Microsoft Fabric July 2024 Update


Welcome to the July 2024 update.
Here are a few, select highlights of the many we have for Fabric. Creating and managing Git branches & connected workspaces with Git integration just got with the latest enhancements to Fabric Git integration. You now have the capability to perform restore-in-place of a warehouse in Microsoft Fabric through the Microsoft Fabric Warehouse Editor. Real-time Dashboards now support ultra-low refresh rates of just 1 and 10 seconds, ensuring you always have the freshest and most accurate data at your fingertips.
There is much more to explore, please continue to read on.
European Fabric Community Conference
Join us at Europe’s first Fabric Community Conference, the ultimate Power BI, Fabric, SQL & AI learning event in Stockholm, Sweden from September 24 -27, 2024.
With 120 sessions, daily keynotes, 10 pre-conference workshops, an expo hall with community lounge, and “ask the expert” area, the conference offers a rich learning experience you don’t want to miss. This is a unique opportunity to meet the Microsoft teams building these products, customers betting their business on them, and partners at the forefront of deployment and adoption.
Register today using code MSCUST for an exclusive discount on top of early bird pricing!
Get certified on Fabric!
We’d like to thank the thousands of you who completed the Fabric AI and 30 Days to Learn It Skills Challenge and earned a discount voucher for Exam DP-600 which leads to the Fabric Analytics Engineer Associate certification.
If you earned a discount voucher, you can find redemption instructions in your email. We recommend that you schedule your exam promptly, before your discount voucher expires.
If you need a little more help with exam prep, visit the Fabric Career Hub which has expert-led training, exam crams, practice tests and more.
Fabric Influencers Spotlight
Check out our latest initiative, the Fabric Influencers Spotlight. Each month, we’ll be highlighting some of the great blog, videos presentations and other contributions submitted by members of Microsoft MVP & Fabric Super User communities that cover the Fabric Platform, Data Engineering & Data Science in Fabric, Data Warehousing, Power BI, Real-Time Intelligence, Data Integration, Fabric Administration & Governance, Databases and Learning.
Governance, Databases, and Learning.
Attention Power BI users!
If you are accessing Power BI on a web browser version older than Chrome 94, Edge 94, Safari 16.4, Firefox 93, or equivalent, you need upgrade your web browser to a newer version by August 31, 2024. Using an outdated browser version after this date, may prevent you from accessing features in Power BI.
Contents
- Reporting
- Modeling
- Data connectivity
- Service
- Developers
- Visualizations
- Paginated Reports
- Power BI Report Server
- Core
- Data Warehouse
- Data Engineering
- Real-time Intelligence
- Data Factory
Check out or Monthly Update video here:
Reporting
Customize your reference layers in the Azure Maps visual
Recently, we’ve brought you a lot of improvements to the Azure Maps visual, including reference layer support for a variety of new data formats. This month, we’re excited to announce several more improvements to reference layers: CSV support, new customization options, and dynamic URL sources!
First, the Azure Maps visual now supports CSV files as data sources for reference layers! Just as you can already use GeoJSON, Shapefiles, WKT, and KML files, you can now upload a CSV file instead in the reference layer section of the formatting pane.
You can also now format reference layer shapes from within the formatting pane. Previously, Azure Maps required you to define the color and width of points, lines, and polygons from within your reference layer files. Otherwise, these shapes would be drawn on your maps with the default colors and formatting. This requirement brought additional complexity to working with your reference layers in Power BI, since the files needed more than just the data you intended to visualize. Now, we’ve added these standard formatting settings to each type of object in your reference layers in the formatting pane, so you can customize them directly from within Power BI!
Lastly, for those of you who need your reference layers to change with time or other data-bound conditions, you can now provide a dynamic URL using conditional formatting! This allows you to set custom logic to determine the reference layer URL the Azure Maps visual will use. For example, you can load in different reference layers based on the categories selected by a slicer, like to visualize performance of different product lines over the same geography.
We’re still hard at work bringing you more improvements to the Azure Maps visual — let us know what you think about these new capabilities and keep an eye out for further updates in the future!
Check out a Reporting demo here:
Modeling
Announcing general availability of enhanced row-level security editor in Power BI Desktop
We are excited to announce the general availability of the enhanced row-level security editor in Power BI Desktop! With this editor, you can quickly and easily create row-level security roles and filters. Simply choose ‘Manage roles’ from the ribbon to open the editor.

By default, this will open an easy-to-use drop-down interface for creating and editing security roles all without having to write any DAX!

If you prefer using DAX or need it for your filter definitions, you can switch to use the DAX editor to define your role. This is a rich editor complete with autocomplete for formulas (intellisense). It also allows you to easily verify the validity of your DAX expressions by selecting the check button and revert any changes by selecting the X button. At any point you can also switch back to the default editor by selecting ‘Switch to default editor’. All changes made in either editor persist when switching interfaces when possible, giving you maximum flexibility as you create your row-level security roles.

Learn more information about Power BI row-level security including limitations in our documentation.
Check out Modeling demos here:
DAX query view is available in live connect
We heard your request and have added the ability to use DAX query view while live connected to a published semantic model. With this release you can write DAX queries with DAX query view when live connected to a published semantic model in Power BI Desktop!
This includes live connecting to the amazing Direct Lake semantic models created in Microsoft Fabric. Live connects to your published Direct Lake, import, DirectQuery, or composite semantic model in Desktop and use the DAX query view to quickly view data without having to create any visuals. Use quick queries to have a DAX query generated for you from any table, column, or measure, and Copilot can help you as you write your DAX queries.

This can be helpful to further your analysis beyond just report authoring even when you are using a published semantic model managed by someone else.

Try it out today and learn more about DAX query view.
Add or update multiple measures in DAX query view
Another popular ask for DAX query view is also now available – add or update the model with multiple measure changes.
In a DAX query, you can use the DEFINE syntax to add a measure. These DAX query scoped measures are helpful for authoring DAX formulas and trying them out with different groups by columns before adding them to the model. In DAX query view, we made it easy to then add these measures to the model by clicking the text between the lines above the DEFINE MEASURE. DAX queries also allow you to define many measures at once, so it can be tedious to click each one. Now this task is very easy with the option to update the model with a single click for all measures!

This can be handy to quickly format all your DAX formulas at once.
- In DAX query view, right-click in the Data pane and choose Quick queries > Define all measures in this model
- Click the Format query button in the ribbon.
- Click Update model with changes button.
And you are done! Try it out today and let us know what you think by using the Share feedback button.
Data connectivity
Certified connector updates
We’re pleased to announce the new and updated connectors in this release:
Are you interested in creating your own connector and publishing it for your customers? Learn more about the Power Query SDK and the Connector Certification program.
Service
Storytelling in PowerPoint – New export to PowerPoint dialog
To reduce complexity and drive more clarity we merged the two options to export to PowerPoint into a single dialog. You can now choose between embedding live data using Power BI add-in for PowerPoint and exporting the report as images from the same dialog.

Check out a Service demo here:
Developers
New update for field parameter feature for custom visuals
sourceFieldParameters is a new property in DataViewMetadataColumn that identifies whether a query field results from a field parameter resolution. If a single field can originate from multiple field parameters, this property will list all the related field parameters. This new update is available with API v5.10.0.
Power BI enhanced report format (PBIR) update
The following previously announced limitations of the PBIR format have been resolved:
- Can’t be exported to PPTX or PDF.
- Can’t be included in Subscriptions
- Mobile layouts aren’t applied.
- Can’t be utilized in Power BI Embedded.
For further information regarding PBIR, please refer to the documentation.
Visualizations
New visuals in AppSource
Smart Grid-Map
Multilevel Matrix Xerppa
Sankey Diagram
Waffle Chart Maker
Waterfall Chart
SPC_Visual
Linear Gauge by Powerviz
Powerviz Linear Gauge is an advanced visual that is used to display the progress against set targets on a linear scale, with an axis displaying a range of values or percentages.
The Linear Gauge quickly conveys the status or progress of a task or value being measured.
Key Features:
- Gauge Styles: Four different gauges including Linear, Bar in Bar, Cylinder, Thermometer, and customization option.
- Templates: Select from pre-made templates or customize your own.
- Scale: Select an absolute or percentage scale, with a customizable min-max range.
- Targets: Set a custom target or apply a target using a value field.
- Data Colors: 30+ color palettes available.
- Band: 30+ color palettes and customization options.
- Labels: Improve readability with labels.
- Small Multiples: Divide visuals based on fields.
- Ranking: Filter Top/Bottom N shows remaining as “Others”.
Other features included are fill pattern, annotation, grid view, show condition, and more.
Business Use Cases:
Sales Performance Tracking, Project Milestone Monitoring, Financial KPI Analysis,
🔗 Try Word Cloud Visual for FREE from AppSource
📊 Check out all features of the visual: Demo file
📃 Step-by-step instructions: Documentation
💡 YouTube Video: Video Link
📍 Learn more about visuals: https://powerviz.ai/
✅ Follow Powerviz: https://lnkd.in/gN_9Sa6U


Drill Down Map PRO by ZoomCharts
When visualizing data with geographic coordinates, what better way to do it than literally placing it on a map? That’s why map charts are a growingly popular visualization type in Power BI reports, and the Drill Down Map PRO custom visual by ZoomCharts expands on the capabilities of map charts.
- Node Clustering: Multiple nearby nodes can create clusters and even display the values as pie charts. Simply zoom in to drill down.
- Base Layer Customization: Choose between AzureMaps or any custom tileserver, use your own images as the base layer, or disable it entirely.
- Custom Shape Layers: Enable up to 10 individually customizable shape layers. Use preset shapes or import your own KML/GeoJSON files.
- Conditional Formatting: Automatically apply color fill to each area by comparing their values against other shapes or by using each shape’s own reference value.
- And More: Paginated tooltip s, custom tooltip fields, auras, node images, lasso tool.
Drill Down Map PRO works incredibly well with other visuals by dynamically cross-filtering data, enabling you to build even more insightful and user-friendly Power BI reports.
🌐Get Drill Down Map PRO on AppSource
Product Page | Documentation | LinkedIn | Community


PowerGantt Chart by Nova Silva
We are excited to receive ongoing feedback from you and want to express our gratitude for your valuable contributions. Your insights help us make significant enhancements to our visuals.
In the latest releases of the PowerGantt Chart, we have added many new features based on your feedback. These include the ability to show incomplete tasks and display progress as a separate column. We’ve also included links in the additional columns and enhanced their formatting options. You can now change the milestone shapes and wrap text in columns for better readability.
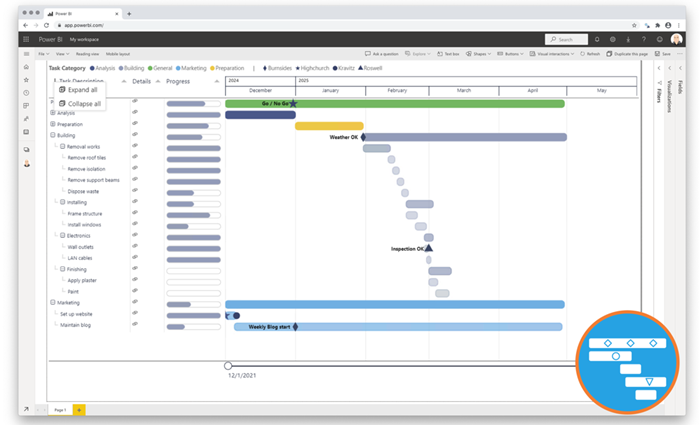
New:
- Progress column
- URL links
- Milestone shapes
- Milestone labels
- Dynamic zoom slider period
- Vertical grid lines
- Expand & Collapse all
Additionally, we’ve added the option to preset the zoom slider, expand and collapse all hierarchy elements, and add milestone labels. To further improve your experience, we’ve enabled the display and formatting of vertical grid lines. These updates are designed to provide you with more flexibility and control over your project visuals.
We appreciate your continued support and look forward to receiving more of your valuable feedback. Together, we can keep enhancing PowerGantt Chart to meet your needs.
Try the PowerGantt Chart for FREE now on your own project data by downloading it from the AppSource.
Questions or remarks? Visit us at: https://visuals.novasilva.com/.
Advanced Geospatial Analytics Made Simple with Icon Map Pro for Power BI
Icon Map Pro, the new professional version of Icon Map, has been built from the ground up with an extensive set of new features and a simplified interface. This tool offers a robust solution for visualising and analysing geospatial data within Power BI. It is designed for data analysts, GIS specialists, and business intelligence professionals, addressing the need for seamless integration of geographic insights into BI dashboards. Users can effortlessly transform complex geospatial data into actionable visuals, enhancing decision-making and strategic planning with the intuitive low/no-code Power BI interface.
Visit the supporting website iconmappro.com for:
Try Icon Map Pro for free from Microsoft AppSource


Paginated Reports
Bind to Gateway API support for paginated reports
You can now bind your paginated reports to gateways with a REST API. This will allow paginated reports to connect to on-prem gateways without requiring users to go to the UI in the Power BI service and bind the report to the specified gateway. Learn more about the Bind to Gateway API for paginated reports.
Parameters, Header/Footer and much more in the web authoring experience for paginated reports (Preview)
We have introduced a new experience to web author paginated reports! It’s not just an update to the look and feel, but we’ve also introduced a host of new capabilities. You can now define parameters, headers, footers, page numbers in your web authored reports. The update will be rolling out in the coming weeks. Please check again in a couple of weeks, if you don’t see it.
Once you select the fields, they will appear in the “Editor” along with a “Preview” of the report with sample data. You can move the table in the “Editor” and the preview will reflect the change as well.

You can choose to add a header, footer, textbox or image. To add a footer, choose “Insert” and select “Footer”.

Add a Text box, Image, page number and/or execution time. You can choose to display the footer and header on the first and last pages as well.

Exit the footer by clicking out, once you are in the body of the report, you can “Create parameter”. By creating a parameter, you can create a report that requires the viewer of the report to enter one or more values to view the report.

When you “Create parameter”, you can see the parameter at the top of the “Preview” portion of the screen. You can show/hide the parameter by clicking on the “Parameters” on the preview ribbon.

When you save the report, it is saved with the parameter defined and the viewer of the report must specify the parameters to view the report. You can now share the report with others!
This is a preview feature and will not be available on Sovereign clouds until we are generally available.
Check out a Paginated Reports demo here:
Power BI Report Server
Power BI Report Server key in Fabric Capacities
Power BI Report Server is now included with F64+ Reserved Instance purchases. It continues to be available with SQL Server Enterprise core licenses with software assurance. You can get the PBIRS key in the “Fabric Capacity” tab under “Capacity Settings” in the admin portal.
Learn more about ways to get the Power BI report server key.

Check out a Power BI Report Server demo here:
Core
General Availability of Fabric Private Links
Private links for Fabric tenant secures inbound access to Fabric from select virtual networks (VNets) and allow you to block access from the internet. Tw With this feature enabled, you can secure connectivity to Fabric Onelake and experiences like Data Warehouse, Data Engineering, Data Science and Data Factory. In addition to the above, we also announced private link support for Eventhouses. To learn more about Azure Private Link Support for Microsoft Fabric.
Check out the blog post to learn more – About private Links for secure access to Fabric – Microsoft Fabric | Microsoft Learn

General Availability of Managed Private Endpoint
Managed private endpoints provide secure connectivity from Fabric to data sources that are behind a firewall or not accessible from the public internet. Managed Private Endpoints currently enable Fabric Data Engineering items to access data sources securely without exposing them to the public network or requiring complex network configurations. Managed private endpoints are supported for various data sources, such as Azure Storage, Azure SQL Database, and many others- the most recent addition being Azure Event Hub and Azure IOT Hub. We will also expand to more workloads as we go.
To learn more about Managed Private Endpoints and supported data sources see Overview of managed private endpoints for Microsoft Fabric – Microsoft Fabric | Microsoft Learn


General Availability of Trusted workspace access
Trusted workspace access allows seamless and secure access to firewall enabled Azure storage accounts. It is designed to help you securely and easily access data stored in Storage accounts from Fabric workspaces, without compromising on performance or functionality. This feature extends the power and flexibility of OneLake shortcuts to work with data in protected storage accounts in place without compromising on security. You can also use this capability with Data pipelines and the COPY INTO feature of Fabric warehouses to ingest data securely and easily into Fabric workspaces.
Trusted workspace access is based on the concept of workspace identity, which is a unique identity that can be associated with workspaces that are in Fabric capacities. When you create a workspace identity, Fabric creates a service principal in Microsoft Entra ID to represent the identity.
A workspace identity enables OneLake shortcuts, data pipelines, and warehouse Copy INTO command to access Storage accounts that have resource instance rules configured. Resource instance rules are a way to grant access to specific resources based on the workspace identity or managed identity. You can create resource instance rules by deploying an ARM template with the resource instance rule details.
To get started with this feature and to learn about limitations, see Trusted workspace access in Microsoft Fabric – Microsoft Fabric | Microsoft Learn
CI/CD – GitHub integration for source control
Organizations who use GitHub or GitHub Enterprise as their source control tool, can now seamlessly integrate with Fabric by connecting Fabric workspaces to GitHub and backup their work. This integration will enjoy the same functionalities that the integration with Azure DevOps offers in Fabric today.
Learn more about the new release.

New Branching Capabilities in Fabric Git Integration
Creating and managing Git branches & connected workspaces with Git integration just got with the latest enhancements to Fabric Git integration. The updated source control pane in every Git-connected workspace now includes these features:
- Branch Out to a New Workspace – Effortlessly create a new isolated environment, allowing developers to work independently without impacting the team’s shared workspace. This makes it quick and easy to get started on new tasks.
- Explore related workspaces – Easily access any workspace connected to the same Git repository and folder, enabling seamless work across different workspaces and branches directly from your current workspace.
These new capabilities come with a redesigned source control pane, which now organizes all features into a couple of streamlined tabs.
For more details and to explore these options, read the full update here.
Check out Core demos here:
Data Warehouse
Announcing the General availability of time travel and 30 days of data retention in Fabric Warehouse
In the rapidly evolving world of generative artificial intelligence, historical data plays a significant role in influencing the decision-making process and shaping organizational strategies. Data retention within data warehouse refers to the practice of preserving and managing previous iterations of the data encompassing any inserts, updates or deletes made to the warehouse for a specified period. As a quick response to the valuable customer feedback, we are thrilled to extend the data retention period to 30 calendar days from 7 calendar days and announce the General availability of Time travel at the T-SQL Statement level.
Extending the data retention period to 30 calendar days opens new avenues for exploration, by leveraging Fabric warehouse features – Time travel at T-SQL statement level, Time travel with table clone, and restore in place.
In the data-centric world, data retention is pivotal in modern data management enabling organizations to utilize historical data effectively for analysis, reporting, compliance, and strategic decision-making. By the utilization of data retention, businesses can extract valuable insights from the past to drive success both now and in the future. In today’s rapidly evolving digital landscape, adaptability is crucial. Our decision to extend the data retention period from 7 to 30 calendar days underscores our commitment to agility and customer-centricity. Come embrace the data retention of 30 calendar days to obtain deeper insights and stay ahead of the curve.
Seamless Data Recovery through Warehouse Restoration within Fabric Query Editor
We are thrilled to announce the capability to perform restore-in-place of a warehouse in Microsoft Fabric through the Fabric Warehouse Editor.
In today’s rapidly evolving data management landscape, maintaining the resilience and continuity of your data infrastructure is essential. Unplanned system failures and scheduled maintenance alike demand the ability to restore data warehouses swiftly and seamlessly. This capability is no longer just a feature – it’s a critical necessity in modern analytics environments. A quick and reliable data warehouse recovery solution is indispensable, not only to protect against data corruption but also to ensure business continuity.
From the moment the warehouse item is created, system restore points are created at least every 8 hours. You can create any number of user-defined restore points aligned with your specific business or organizational recovery strategy. Both system-created and user-defined restore points come with a retention period of 30 calendar days. You can view all restore points in warehouse settings.
To create user-defined restore points, go to Warehouse Settings -> Restore points and Add a restore point by providing Name and Description. Then click on context menu action to restore the warehouse item back to that point.

To learn more about Restore in-place of a warehouse, please refer to documentation and announcement
Alter Table, Add Nullable columns
We are excited to announce the General Availability of Alter Table – Add Nullable columns! In the ever-evolving data landscape of data organizations, schemas are shifting and changing to keep up with the influx of new data.
Whether your schema modifications are few and far between, or a regular occurrence that constantly needs to adapt to changing requirements, we have you covered. Our goal is to ensure that customers have everything they need for a seamless warehousing experience, and we continue to strive towards ensuring our TSQL surface area meets the needs of our customers.
Here are some example syntaxes to get started with ALTER TABLE functionality. Note that today we only support the ability to add nullable columns to the Warehouse table.
ALTER TABLE [Contoso].[dbo].[Customers]
ADD [Customer_County] varchar(30)
Check out our Data Warehouse demo here:
Data Engineering
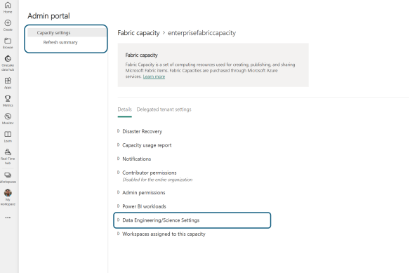
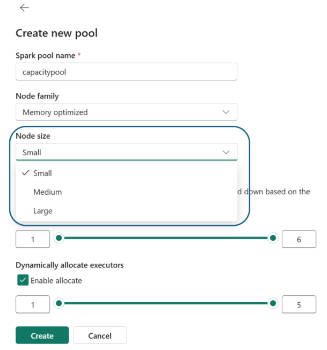
Capacity Pools for Spark in Microsoft Fabric for Data Engineering and Data Science
We’re excited to introduce the public preview of Capacity Pools, designed specifically for Fabric Data Engineering and Data Science workloads. With this new feature, capacity administrators can create custom pools using the capacity spark settings option. Here’s how:
Navigate to the Capacity Settings Page:
- Go to the Admin Poral -> Capacity Settings Page.
- Navigate to the “Data Engineering/Science Settings”.
Create New Pools:
- Within the Spark Settings, you’ll find the option to create new pools.
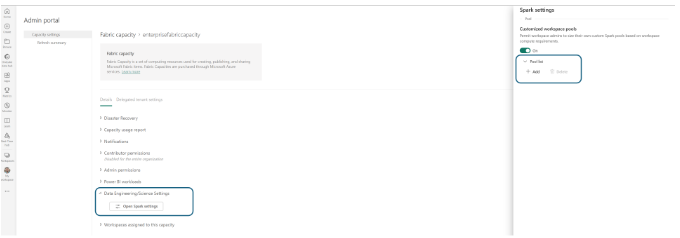
- These pools can be sized based on the Max Burst Cores limit for Spark your Fabric Capacity SKU.
Availability Across Workspaces:
- Once configured and saved, these pools become available for all workspaces connected to the Fabric capacity.
- Workspace administrators will see the newly created Capacity pool listed among their available options.
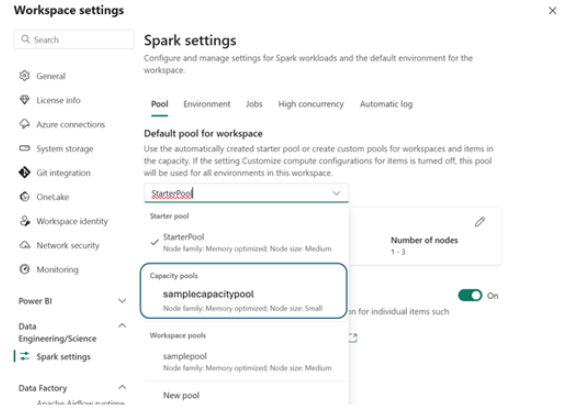
- Data Engineers or Data Scientists using Environments will also see the newly created Capacity pool listed among their available compute options.
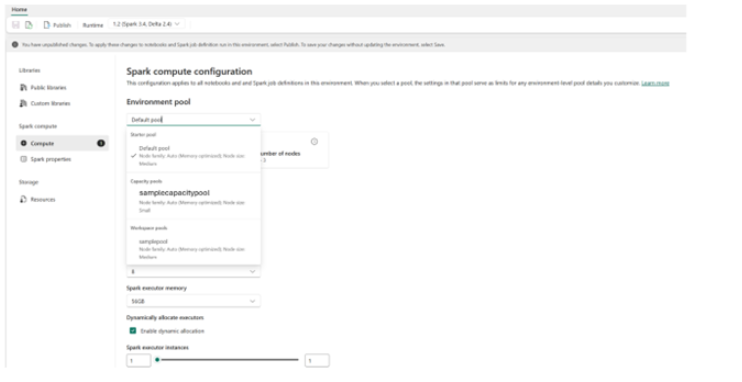
With these options Capacity admins gain additional controls to manage compute governance for Spark compute in Microsoft Fabric. You can create pools for specific workspaces and even disable workspace-level customization.
Environment Resources folder
We are thrilled to announce the launch of our new Environment Resources Folder, a shared repository designed to streamline collaboration across multiple notebooks! In the existing notebook the resources folder provides a per notebook resources to store small sized dataset, sample files, code modules and configuration files etc. It provides convenient browsing, folder structure management, upload/download, drag and drop and simple file interactions.
In the recent release, the resources functionality is extended to the Environment, you can find the Resources tab inside the environment and have the full operations to manage the resource files here, and these files can be shared across multiple notebooks once the notebook is attached to the current environment, you can leverage this enhancement to better collaborate with the team on large project with shared resources.

In the Notebook page, you can easily find a second root folder under Resources inherited from the attached environment, and you operate on the files/folders just same with the Built-in resources folder, you can easily drag & drop different files into the code cell, and we’ll generate the executable code snippet to help you consume the file easily. The Environment resource path will be automatically mounted to the notebook cluster, you can use the relative path /env to access the environment resources.

For more detailed usage please find the public document here: How to use notebooks – Microsoft Fabric | Microsoft Learn
MSSparkUtils new API
We are excited to announce that mssparkutils.runtime.context is available to all now! With the new API you can get the context information of the current live session, including the notebook name, default lakehouse, workspace info, if it’s a pipeline run, etc. And the context information is very useful when you want to have more advanced implementation logic inside notebook.
For more information, see Microsoft Spark utilities documentation.
Lakehouse Schemas (Public Preview): A New Way to Organize Your Tables
We are excited to announce the release of lakehouse schemas. It is a new feature that allows you to group and manage your tables in logical namespaces. With lakehouse schemas, you can organize your tables into categories, such as business domains, projects, or teams. You can reference multiple tables at once using schema shortcuts, instead of shortcutting each table individually. Apply security policies to schemas for more granular access control, such as granting or revoking permissions to a group of tables at once. You can also cross-reference and join tables from different workspaces using Spark SQL, without having to copy or move data.
- Lakehouse schemas is a new feature that enables logical grouping and management of tables in namespaces.
- With lakehouse schemas, users can organize tables by categories, use schema shortcuts, apply security policies, and cross-reference tables from different workspaces.
- The feature is available for public preview.

For more detailed information find the public documentation here: Lakehouse schemas (Preview) – Microsoft Fabric | Microsoft Learn
Check out our Data Engineering demo here:
Real-time Intelligence
Real-Time Dashboards 1s and 10s refresh rate
Real-time Dashboards now support ultra-low refresh rates of just 1 and 10 seconds, ensuring you always have the freshest and most accurate data at your fingertips. With the auto-refresh feature, your dashboards update automatically, eliminating the need to manually reload the page or click a refresh button.
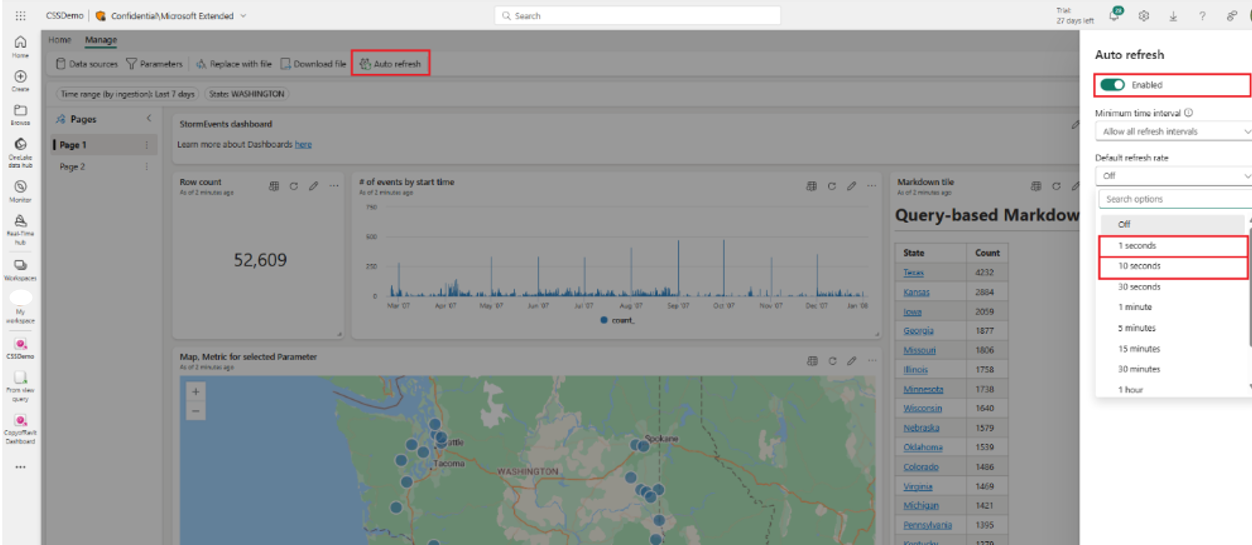
Learn more about enabling Real-Time Dashboards auto refresh and setting the refresh rate Create a Real-Time Dashboard (preview) – Microsoft Fabric | Microsoft Learn
KQL Database – .update command GA
Eventhouse and KQL databases are optimized for append ingestion.
In recent years, we’ve introduced the .delete command, allowing you to selectively delete records.
In February, we introduced the .update command in public preview. This command allows you to update records by deleting existing records and appending new ones in a single transaction.
The .update command is now Generally Available (GA)!
We encourage you to go through the many examples of the online documentation page to familiarize yourself with the syntax.
Data Factory
Dataflow Gen2
Global view in Manage connections
Manage connections is the feature that allows you to see and edit all the connections in your Dataflow and data sources that don’t have any linked connection so you can create a new one.

Starting today, we’re adding a new Global view to the Manage Connections that will also allow you to see all the available connections in your Fabric environment so you can modify them or delete them without ever having to leave the Dataflow experience.

Previously, if you wanted to delete a connection you would’ve had to go into the Manage Connections and Gateways portal to do so, but now you have an alternative way without ever having to leave the Dataflow experience.
You can learn more about the Manage Connections feature from the official documentation article.
Support for editing Navigation steps
Whenever you connect to a data source that showcases a Navigation dialog you end up with a query that has a Source step and either one or a series of Navigation steps. For example, when you use the Lakehouse connector you can navigate to the workspaces that you have access to, then the Lakehouse within them and the objects found within your Lakehouse so you can navigate to them. Another example is when you connect to an OData service like Northwind that displays a list of tables available to you.

What if you wanted to connect to a different object within your Lakehouse or perhaps a completely different Lakehouse?
Introducing the new experience to edit navigation steps within DataflowYou can find it inside of the Applied steps section of the Query settings pane by double clicking a Navigation step or clicking on the gear icon.

It is similar to the way that a navigation step behaves in Power Query Desktop (in Excel and Power BI Desktop), but the main difference is that it is available for all Navigation steps, and it only modifies the Navigation steps. It doesn’t result in deletion of subsequent steps like it happens in Power Query Desktop (in Excel and Power BI Desktop).

We encourage you to give this new feature a try and share your feedback in our Data Factory community forum.
On-Premises support for Fast Copy
You can now boost your performance with Fast Copy in Dataflow gen2 when loading data from on-premises data stores including SQL Server.
The way you configure Gateway in Dataflow gen2 to get access to on-premises data stores, it is the same for Fast Copy in Dataflow gen2. By doing so, you can ingest terabytes of data from on premise store with the easy experience of dataflows, but with the scalable back end of the pipeline Copy Activity.
Learn more about Fast Copy in Dataflow Gen2.

Certified connector updates
Check out the new and updated connectors in this release:
- [New] Windsor
- [Update] SingleStore
- [Update] Smartsheet
- [New] BuildingConnected
- [New] OneStream
- [Update] Exact Online Premiumv
- [Update] Funnel
- [Update] Wolters Kluwer CCH Tagetik
- [Update] Delta Sharing
Data pipeline
Edit JSON code for Data pipelines
You can now edit the JSON behind your Data Factory pipelines in Fabric
Fabric Data Factory is the low-code data integration service in Microsoft Fabric that includes dataflows, data pipelines, and many other data integrations and ETL capabilities. When designing your low-code pipeline workflows, directly editing the JSON code behind your visual pipeline canvas can increase your flexibility and improve your market time. Long-time ADF and Synapse developers have also asked for this capability in Fabric, and we are super excited to now announce the edit JSON capability has been added to Fabric Data Factory data pipelines!
New connectors
We are excited to announce the release of two powerful new connectors in Fabric Data Factory data pipeline: Azure MySQL Database Connector and Azure Cosmos DB for MongoDB Connector.
These connectors are designed to significantly enhance your data integration and management capabilities. The Azure MySQL Database Connector enables seamless, secure, and efficient integration with MySQL databases hosted on Azure, simplifying data workflows and ensuring robust performance.
Meanwhile, the Azure Cosmos DB for MongoDB Connector offers unparalleled ease of connection to Azure Cosmos DB for MongoDB instances, providing high compatibility and performance for your NoSQL data needs.
Elevate your data integration experience with these new connectors in Fabric Data Factory and unlock the full potential of your data ecosystems.
Learn more here.
Snowflake storage integration
We are thrilled to announce a powerful new feature in the Fabric Data Factory Snowflake Connector to support Snowflake storage integration.
This enhancement allows users to seamlessly connect and integrate Snowflake’s storage integration, enabling more efficient and secure data movement. With Snowflake storage integration, you can streamline data workflows, optimize performance across all staging scenarios without the need to bring external storage to stage your dataset as you do today. This update not only simplifies your data integration processes but also significantly expands your ability to move data from or to Snowflake with richer authentication methods through staged approach and thus improves the security.
Learn more here.
Use existing connections from the OneLake Datahub integration
We are excited to share the new capability of OneLake Datahub at the homepage of Modern Get Data in Data Pipeline. Now you can select any existing connections from OneLake Datahub, not just your recent and favorite ones. This makes it easier to access your data sources from the homepage of modern get data in data pipeline.
Learn more here.


